
For land and housing development in England
Land, value and viability in one linked model.
The Bluepencil Development Model brings land budget, character-based capacity, policy, Section 106, appraisal, cashflow and plot pricing together, so a single change flows through to value and profit straight away.
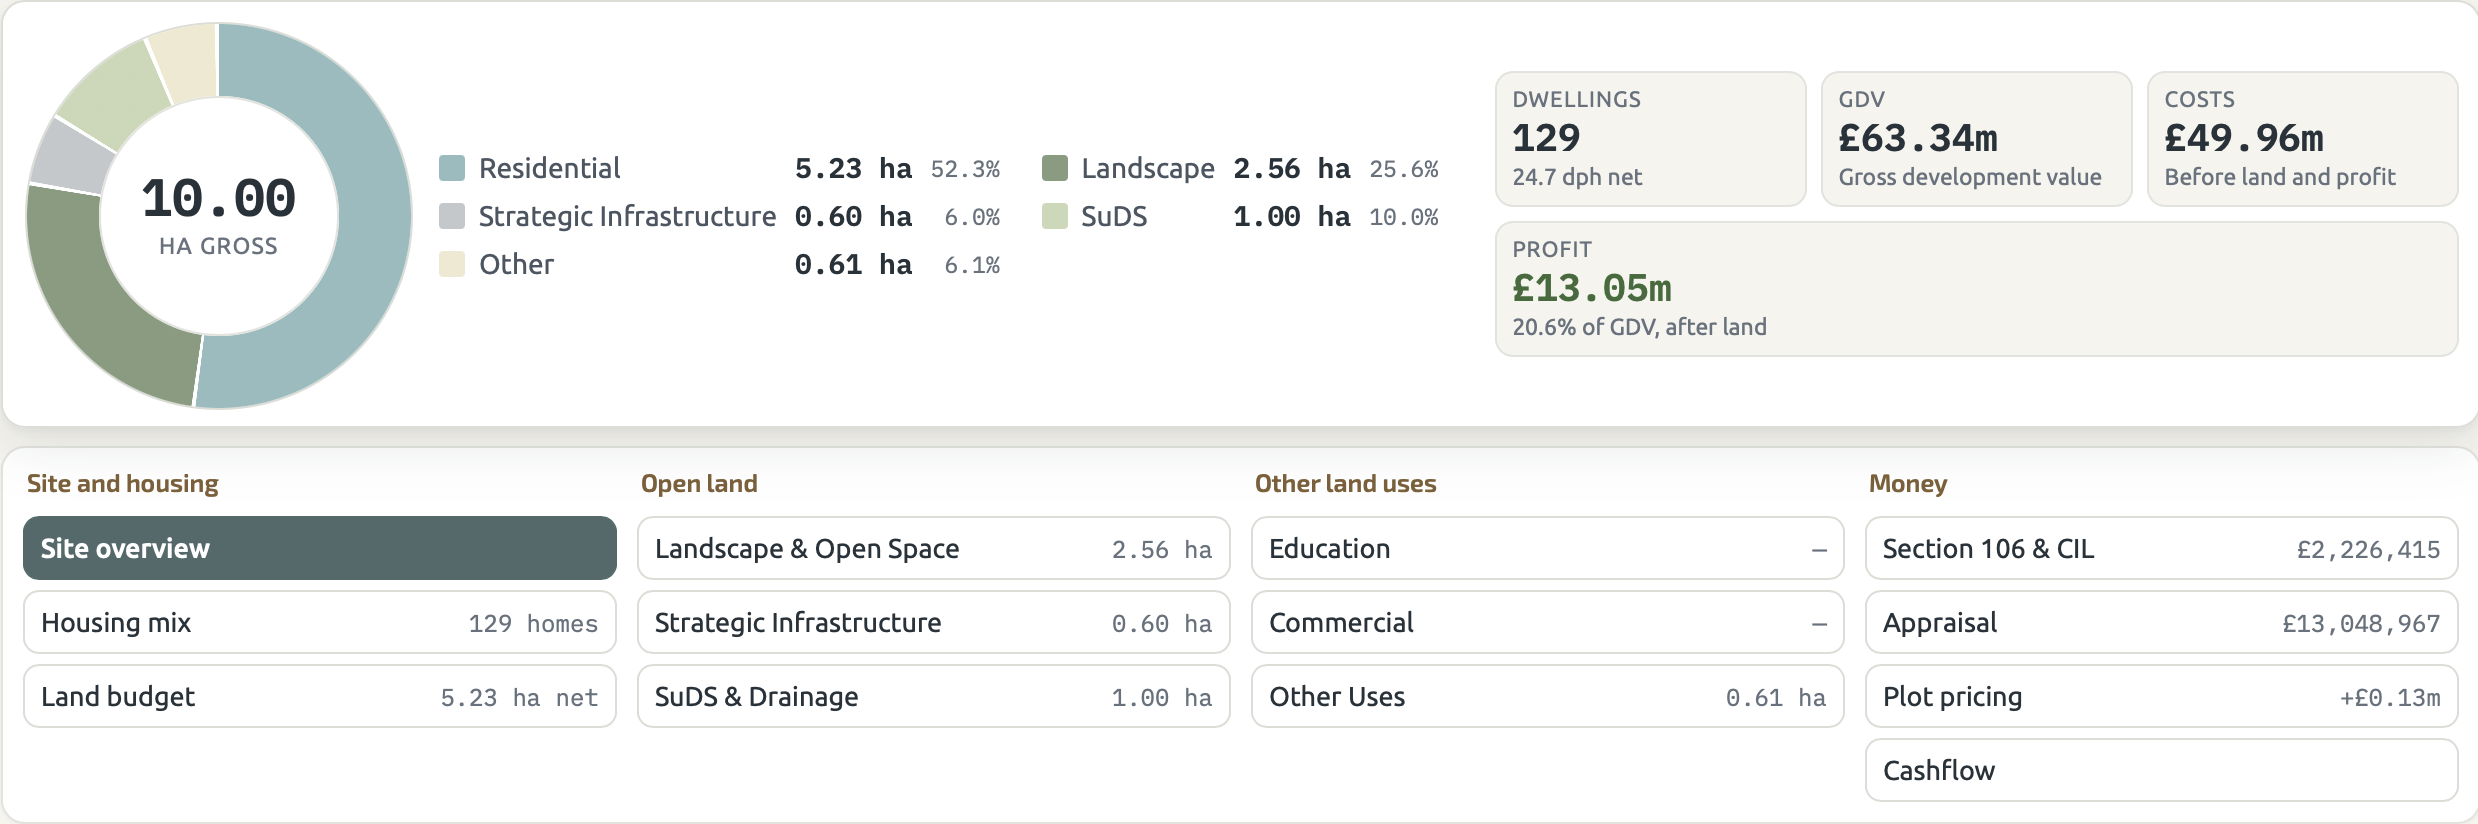
Between a guess and a masterplan
Most sites are judged on a single density figure or wait months for a full masterplan. The model gives you a realistic range in between, based on the character of the place.
The guess
"35 dwellings per hectare"
Quick, but blind to open space, drainage, roads and the kind of place the site sits in. It can flatter the land or undersell it.
The Bluepencil model
A realistic range, in minutes
Capacity by character, a full land budget, value, cost and land value, with an honest confidence range that narrows as evidence goes in.
The masterplan
Accurate, but slow and costly
The right tool once a site is going ahead. Too much to commission before you know whether it is worth pursuing.
How it works
Type in the site area and choose the council. Every box opens with a sensible default, so a first answer takes about five minutes.
-
1
Site area
Enter the gross site area once. Everything else is worked out from it.
-
2
Land budget
Open space, roads and drainage come off automatically, leaving the land for homes.
-
3
Capacity by character
Rural edge, Village, Edge of settlement or Suburban: a range of homes that suits the place.
-
4
House types, value and cost
Twelve house types with density, floor area, build cost and sales value already set, all yours to change.
-
5
Land value
What the scheme can pay for the land, tested against the benchmark land value.
One set of figures for everyone at the table
Landowner, agent, housebuilder and council can all work from the same model, and see exactly how each figure was reached.
Landowners
See what your land could deliver and be worth before you talk to a promoter or housebuilder.
Land agents, buyers and promoters
Test a site in minutes and show your client the reasoning, not just the number.
Housebuilders
From capacity to cashflow and plot-by-plot sales pricing, in one place.
Local authorities
Override the defaults with your own policies and test what schemes can carry.
Town planners
From early feasibility advice through to Section 106 negotiations.
Architects and landscape architects
A character-based capacity range and land budget to brief the masterplan from.
Three tiers that grow with the site
From a first feasibility answer in minutes to detailed design priced plot by plot. Every figure carries a confidence range that narrows as evidence replaces defaults. Each tier includes the ones before it. Try Feasibility free for 7 days, with no card details needed.
Feasibility
A first look at a site, nothing measured yet.
[£ price] a month
- Land budget and capacity by character
- Rough appraisal
- Feasibility report
- Confidence ±25%, narrowing to ±15%
Outline
Preparing or negotiating an outline application.
[£ price] a month
- Everything in Feasibility
- Section 106 and CIL
- Full appraisal, land value and sensitivity
- Density tiles for your own house types
- Land deal: sell now, option or promotion
- Outline report
- Confidence ±10%, narrowing to ±7%
Detailed Design
A layout exists and can be measured.
[£ price] a month
- Everything in Outline
- Itemised infrastructure and drainage costs
- Cashflow and plot-by-plot sales pricing
- Open space management and estate charges
- All reports, including Viability and Contributions
- Confidence ±5%, narrowing to ±3%
Honest about how sure it is
Every answer carries a confidence range. It starts wide and narrows only when a default is replaced with real evidence: your land price, the council's adopted policy, your own build costs.
It never reaches zero, because sales values, costs and finance still move before the last home is sold.
Light band: where each tier starts. Dark band: how far evidence can narrow it.

Built by designers of real places
Bluepencil brings 30 years of data-linked 3D models of housing sites, and a 100% planning success track record.
The model was developed from experience inside a leading housebuilder as well as in architecture and masterplanning, so it reflects how sites are really bought, designed and built. Its capacity ranges come from the Bluepencil Manual of Housing Density, so the numbers reflect the character of each place rather than a rule of thumb.
"I built the model to solve one problem shared by everyone in housing delivery: nobody can see the whole picture early. Land take, housing numbers, policy, contributions and value sit in different hands and different spreadsheets. The model brings them together in one place, from first feasibility through to Section 106 and plot pricing."
Get a first answer for your site today
Start a free 7-day Feasibility trial, with no card details needed. Enter your site area and and see what it could deliver in about five minutes.