
How the model works
It follows the same logic a developer uses, in five linked stages. Each one feeds the next, so a change anywhere flows straight through to value and profit.
The site and the council
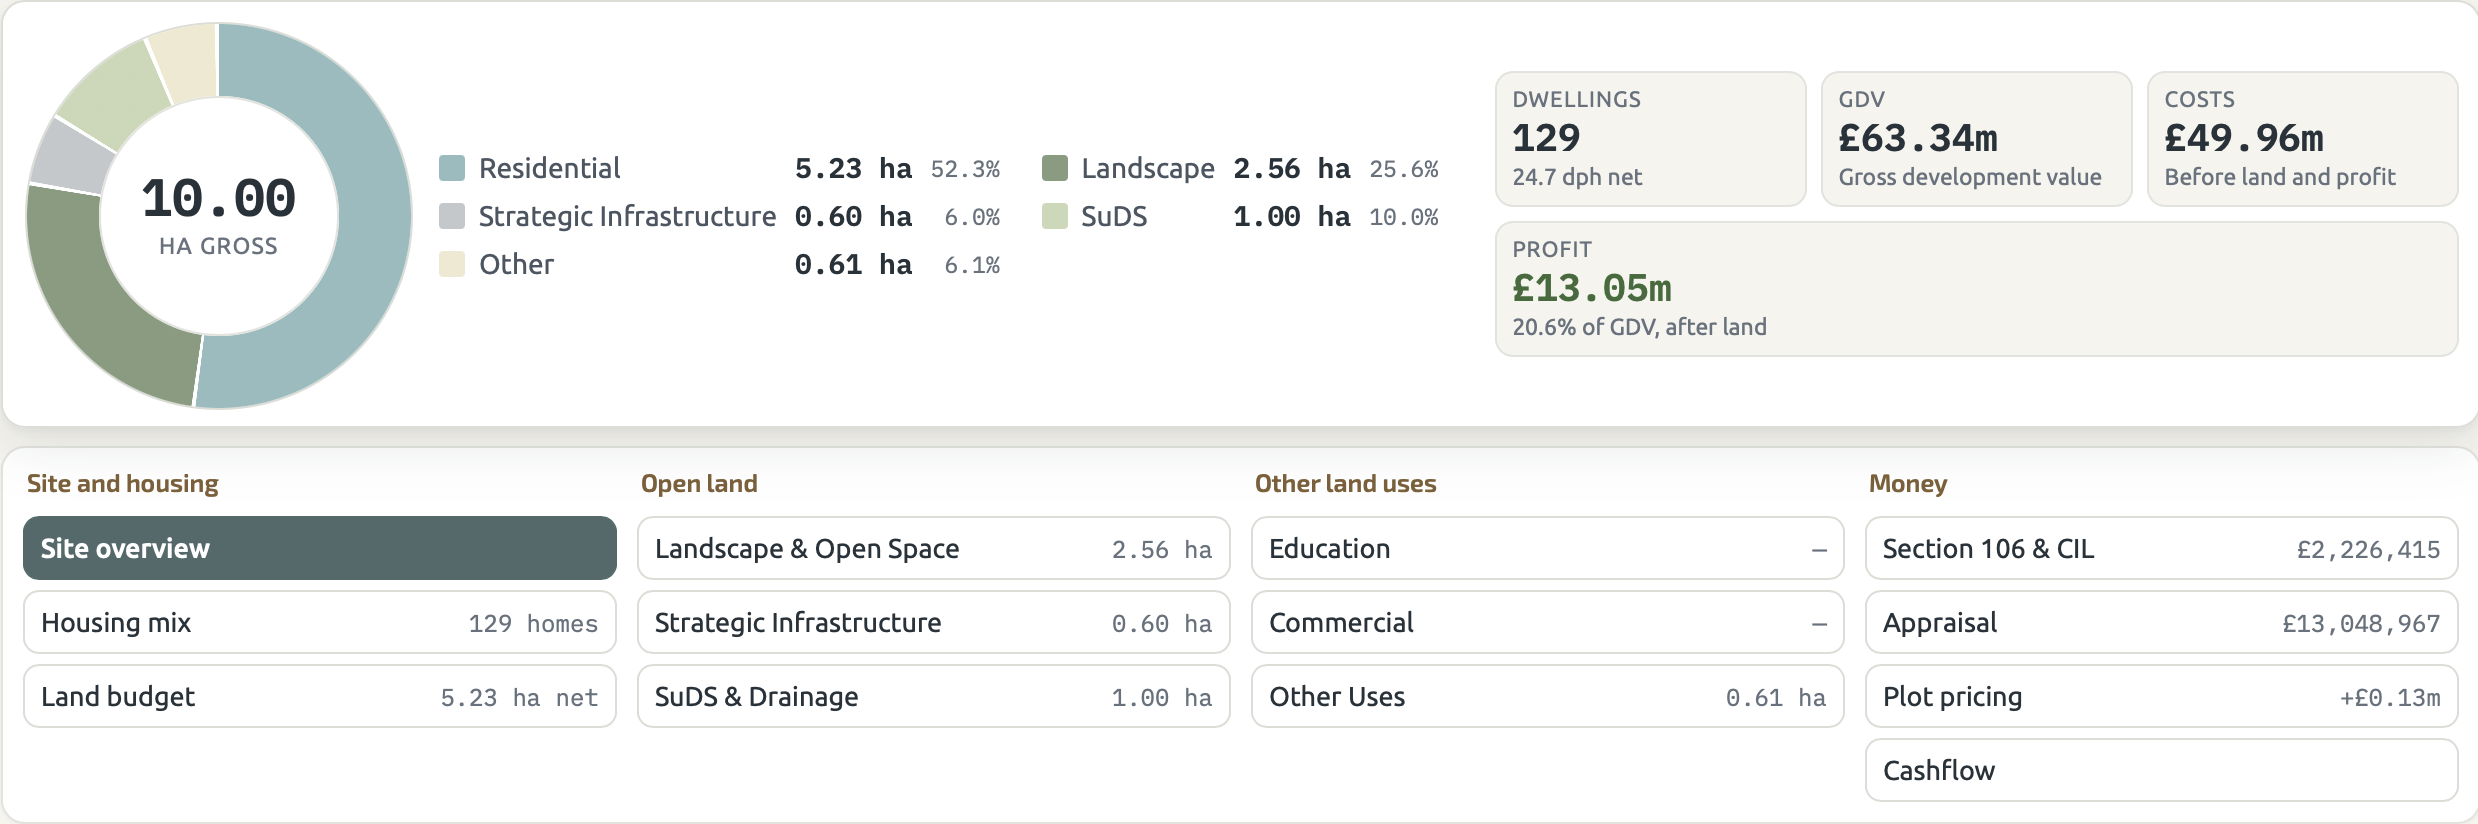
Enter the gross site area once, in hectares: the whole site inside the red line. It's then locked, because everything else is worked out from it. Choosing the council sets the open space requirement and the contribution figures.
The land budget
Not all of a site can be homes. The model takes out landscape and open space, strategic roads and sustainable drainage automatically. Add a school, shops or a care home and the land for homes shrinks to match. What's left is the Net Residential Area.
Capacity by character
Instead of one density figure, you choose the character of the place. The model gives a realistic range of homes, from a looser mix to a tighter one, based on the Bluepencil Manual of Housing Density. The characters match the area types in the National Model Design Code.
Rural edge
Rural settlements. Mostly 3 and 4 bedroom houses.
Village
Villages.
Edge of settlement
Outer suburbs.
Suburban
Suburbs.
The model covers houses and flats up to three storeys.
House types you control
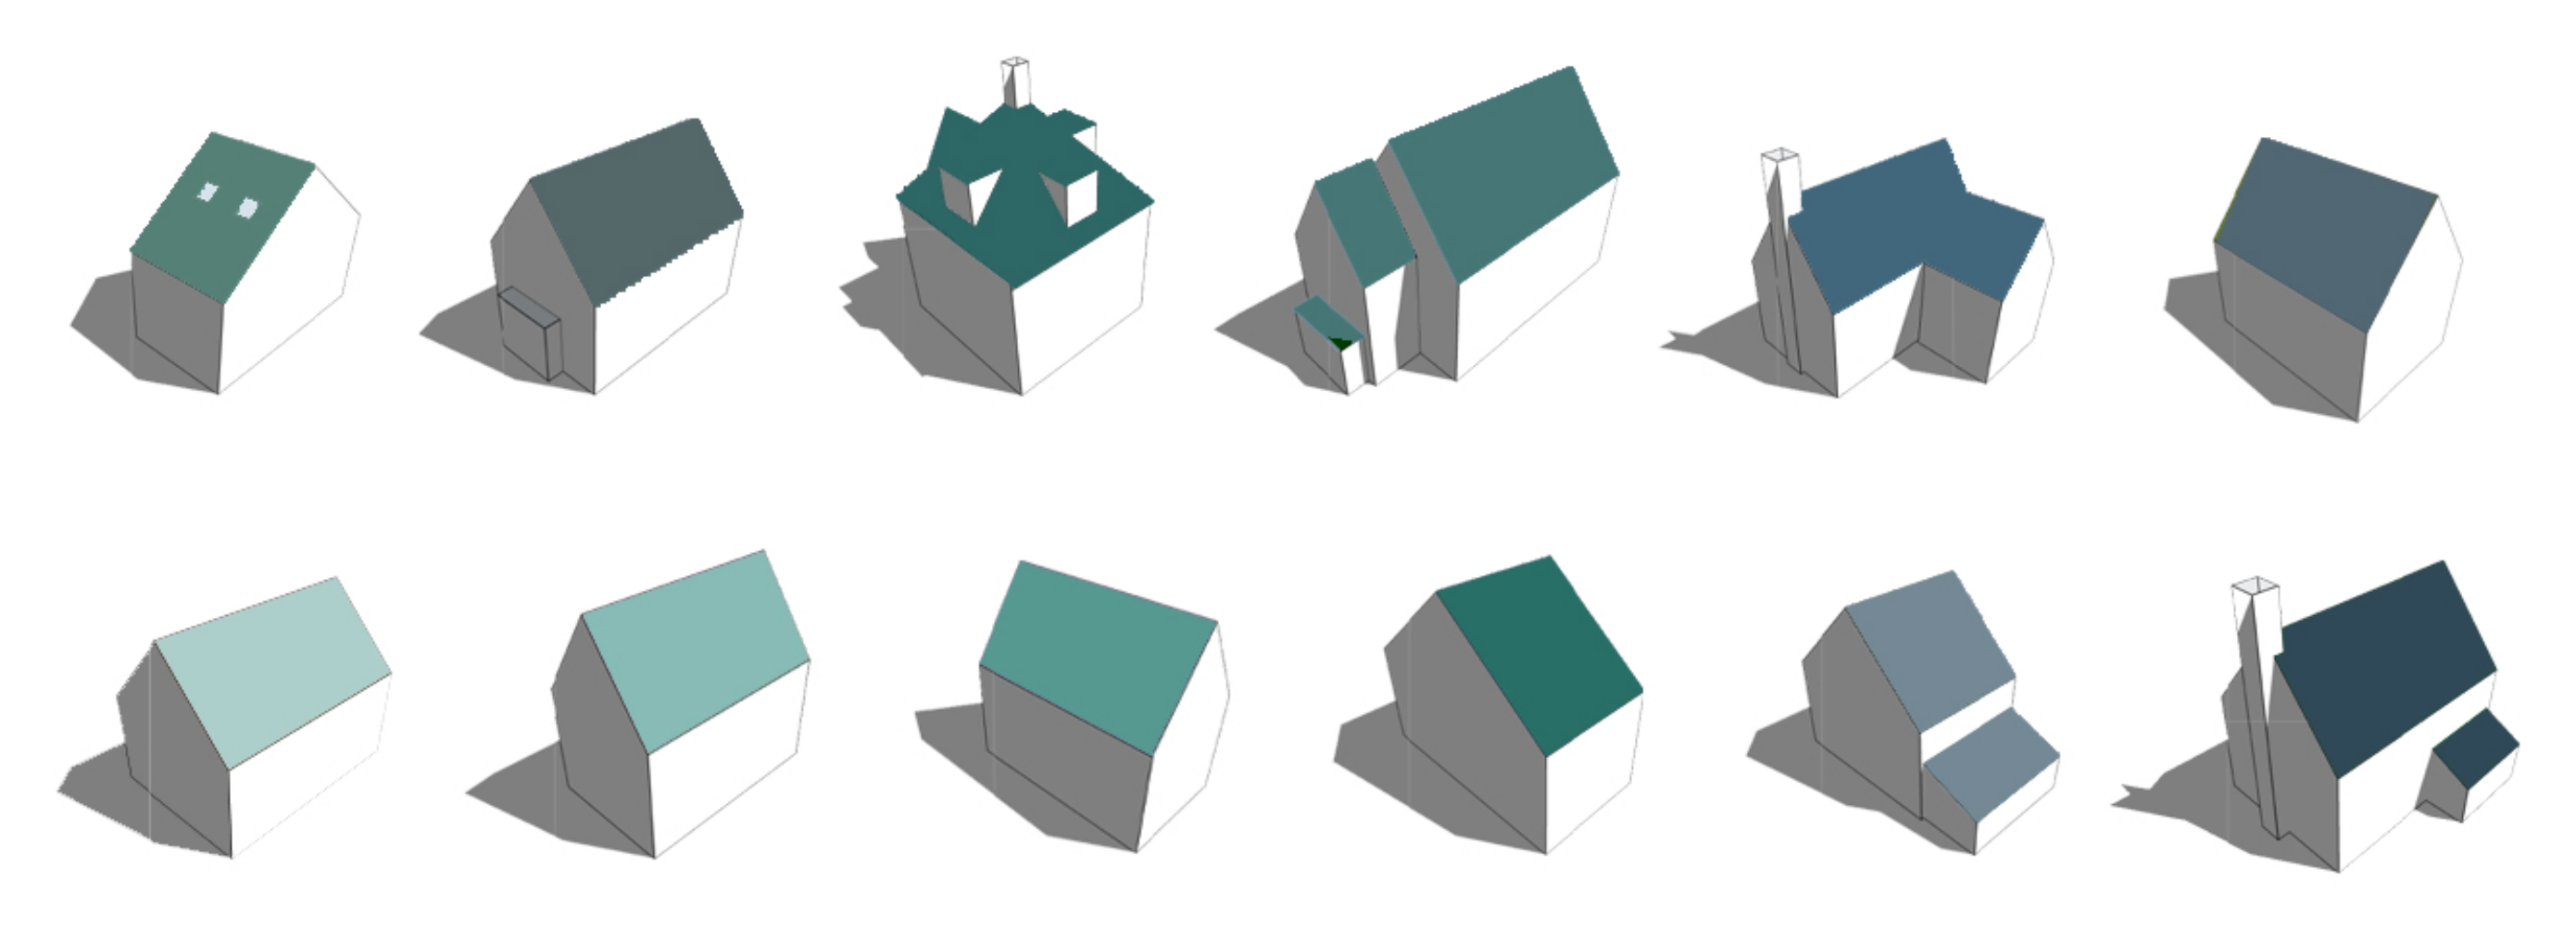
Twelve house types ready to use. Every figure is yours to change.
Each house type comes with its plotting density, floor area, build cost and sales value already set, so you get an answer straight away. Change any of them to match your own house types, costs and local market, rename them, or add your own. Every change flows straight through to capacity, value and profit.
Plotting density
Homes per hectare for each house type, so capacity reflects what you'd actually build.
Floor area (GIA)
Set the size of each home to match your own designs or a housebuilder's range.
Build cost
Defaults from a regional cost matrix, at budget, standard or premium specification. Replace them with your own rates.
Sales value
Defaults from current new build asking prices. Use your own local evidence.
Value and cost
Your house types and their sales values make the Gross Development Value. The model then takes off build costs, infrastructure, drainage, fees, finance, Section 106 and CIL contributions, and the developer's profit, line by line.
Land value
What remains is what the scheme can afford to pay for the land. The model tests it against the benchmark land value (the existing use value plus a landowner premium) and shows how it moves with density, affordable housing and contributions.
Beyond the appraisal
Three tools answer the questions that come up once the numbers work: how dense a new house type can be, what the landowner will actually receive, and who pays to look after the open space.
Outline and Detailed Design
Density tiles
Adding a house type of your own? Enter its footprint and parking, and the model lays it out on a standard one-hectare tile, with roads, gardens and fence lines, to show how many homes it fits. That density becomes the evidence for the land it needs, and it is listed in your reports.
Outline and Detailed Design
Land deal
Compare selling now with an option agreement or a promotion agreement, using the land value from your own appraisal. See what the landowner receives under each, when the money arrives, and what it is worth today.
Detailed Design
Open space management
Cost the upkeep of the open space, play areas and drainage from your layout, then compare council adoption, paid once as a commuted sum, with a management company and the yearly charge each home would pay.
Three tiers, one site
Start at Feasibility and move up only when there's better information to put in. Your figures carry across.
Feasibility
A first look, nothing measured. A complete answer in about five minutes.
Confidence ±25%, narrowing to ±15%
Outline
Figures that stand up in front of a council: verified policy, Section 106 and a full appraisal.
Confidence ±10%, narrowing to ±7%
Detailed Design
Quantities measured from a layout, cashflow, and a plot-by-plot price list for the sales team.
Confidence ±5%, narrowing to ±3%
Reports you can share
Every report prints its confidence range and assumptions, and says which policy figures were verified. Anyone reading it can see how each figure was reached.
| Report | Who it's for | What it holds |
|---|---|---|
| Feasibility | An early conversation | Land use, capacity range, value, Section 106 and CIL, rough appraisal |
| Outline | A planning audience | Adds housing mix, open space, policy profile and full appraisal |
| Detailed Design | Anyone who will ask how a figure was reached | Everything, including infrastructure build-up, plot price lists and cashflow |
| Viability and Contributions | A Section 106 negotiation | Contributions, the policy behind them, and whether the scheme can carry them |
Try it on your own site
Free for 7 days at Feasibility. No card details needed.
Start your free 7-day trial